Earth Science worksheet
    Topic: Key To Weather Map Symbols
    Key To Weather Map Symbols
    1

    Which type of air mass would most likely form over the Pacific Ocean north of the Aleutian Trench?

    (1) mP

    (2) mT

    (3) cP

    (4) cT

    Base your answers to questions 2 on the map below, which shows the position of the jet stream relative to two air masses and a low-pressure center (L) over the United States.

    reference-tables, selected-properties-of-earth-atmosphere, meteorology, transfer-of-heat-energy, meteorology, jet-streams, meteorology, the-atmosphere, standard-6-interconnectedness, models fig: esci82012-examw_g44.png

    2

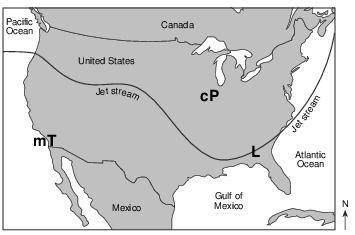
    What is the difference in the air temperature and humidity between the cP and mT air masses?

    (1) The cP air mass is warmer and less humid.

    (2) The cP air mass is colder and more humid.

    (3) The mT air mass is warmer and more humid.

    (4) The mT air mass is colder and less humid.

    Base your answers to questions 3 on the cross section below and on your knowledge of Earth science. The arrows on the cross section represent the air movement along a weather front between two different air masses. The air masses are labeled.

    meteorology, presentation-of-weather-data, meteorology, front, standard-6-interconnectedness, models fig: esci12020-examw_g30.png

    3

    Which statement best describes the difference in air temperature and humidity between the cP and mT air masses?

    (1) The mT air mass is warmer and more humid.

    (2) The mT air mass is cooler and less humid.

    (3) The cP air mass is warmer and less humid.

    (4) The cP air mass is cooler and more humid.

    4

    Which type of air mass most likely has high humidity and high temperature?

    (1) cP

    (2) cT

    (3) mT

    (4) mP

    Base your answers to questions 5 on the weather map below. The map shows isobars and seven weather station models. Four of the weather stations are identified by letters A, B, C, and D.

    reference-tables, key-to-weather-map-symbols, meteorology, presentation-of-weather-data, standard-6-interconnectedness, models fig: esci12012-examw_g32.png

    5

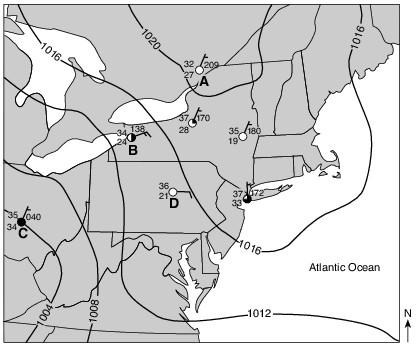
    Which weather station had the highest relative humidity?

    (1) A

    (2) B

    (3) C

    (4) D

    6

    When it is solar noon at a location at 75° W longitude, what is the solar time at a location at 120° W longitude?

    (1) 9 a.m.

    (2) 12 noon

    (3) 3 p.m.

    (4) 12 midnight

    Base your answers to questions 7 on the weather map below, which represents a low-pressure system over New York State. The L on the map represents the center of the low-pressure system. Two fronts extend from the center of the low, and are labeled front 1 and front 2. Cloud cover has been omitted from the station models.

    meteorology, presentation-of-weather-data, meteorology, weather-variables, standard-6-interconnectedness, models fig: esci62012-exam_w_g14.png

    7

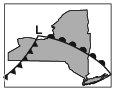
    Which map best represents the type of fronts and direction of movement of these fronts in relation to the low-pressure center?

    (1) reference-tables, key-to-weather-map-symbols, meteorology, presentation-of-weather-data, meteorology, front, standard-6-interconnectedness, models fig: esci62012-exam_w_g6.png

    (2) reference-tables, key-to-weather-map-symbols, meteorology, presentation-of-weather-data, meteorology, front, standard-6-interconnectedness, models fig: esci62012-exam_w_g7.png

    (3) reference-tables, key-to-weather-map-symbols, meteorology, presentation-of-weather-data, meteorology, front, standard-6-interconnectedness, models fig: esci62012-exam_w_g8.png

    (4) reference-tables, key-to-weather-map-symbols, meteorology, presentation-of-weather-data, meteorology, front, standard-6-interconnectedness, models fig: esci62012-exam_w_g9.png

    8

    The map of North America below shows the source region of an air mass forming mostly over Mexico.

    reference-tables, key-to-weather-map-symbols, meteorology, transfer-of-heat-energy, meteorology, air-mass, standard-1-math-and-science-inquery, changing-length-of-a-shadow-based-on-the-motion-of-the-sun, standard-6-interconnectedness, models fig: esci12015-examw_g11.png

    This air mass originating over Mexico is classified as

    (1) continental polar

    (2) continental tropical

    (3) maritime polar

    (4) maritime tropical

    9

    The station model below shows some weather conditions at a location on Earth’s surface.

    reference-tables, key-to-weather-map-symbols, meteorology, presentation-of-weather-data, standard-1-math-and-science-inquery, changing-length-of-a-shadow-based-on-the-motion-of-the-sun, standard-6-interconnectedness, models fig: esci12015-examw_g3.png

    Which present weather symbol represents the most likely type of precipitation occurring at this location?

    reference-tables, key-to-weather-map-symbols, meteorology, presentation-of-weather-data, standard-1-math-and-science-inquery, changing-length-of-a-shadow-based-on-the-motion-of-the-sun, standard-6-interconnectedness, models fig: esci12015-examw_g9.png

    (1) 1

    (2) 2

    (3) 3

    (4) 4

    10

    Which rock will weather at the fastest rate when exposed to acid rain?

    (1) granite

    (2) limestone

    (3) gneiss

    (4) quartzite

    Base your answers to questions 11 on the weather map below and on your knowledge of Earth science. On the weather map, the location of the center of a high-pressure system (H) and a front are shown. Isobar values are labeled in millibars (mb). Weather station models represent the weather conditions at Atlanta, Georgia, and Tampa, Florida.

    reference-tables, key-to-weather-map-symbols, meteorology, presentation-of-weather-data, standard-1-math-and-science-inquery, changing-length-of-a-shadow-based-on-the-motion-of-the-sun, standard-6-interconnectedness, models fig: esci12018-examw_g53.png

    11

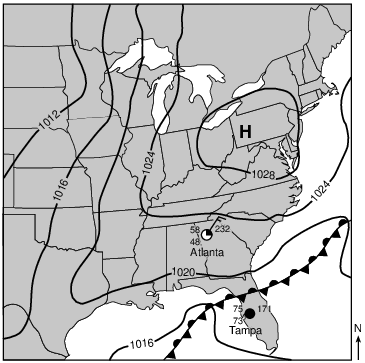
    Describe one piece of evidence shown on the map that indicates that Tampa, Florida, has a high probability of precipitation. [1]

    Allow 1 credit. Acceptable responses include, but are not limited to:

    • — The dewpoint and air temperature are close together./high relative humidity

    • — 100% cloud cover/overcast

    • — Tampa is close to a front.

    • — The air pressure is low.

    Base your answers to questions 12 on the weather map below and on your knowledge of Earth science. The map indicates the location of a low-pressure system over New York State during late summer. Isobar values are recorded in millibars. Shading indicates regions receiving precipitation. The air masses are labeled mT and cP. The locations of some New York State cities are shown. Points A and B represent other locations on Earth’s surface.

    reference-tables, key-to-weather-map-symbols, meteorology, transfer-of-heat-energy, meteorology, air-mass, standard-1-math-and-science-inquery, geocentric-model-heliocentric-model, standard-1-math-and-science-inquery, changing-length-of-a-shadow-based-on-the-motion-of-the-sun, standard-6-interconnectedness, systems-thinking fig: esci62015-exam_g36.png

    12

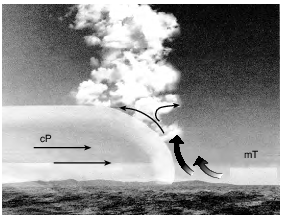
    An air mass acquires the characteristics of the surface over which it forms. In image below, circle the type of Earth surface (land or ocean) and describe the relative temperature of the surface over which the mT air mass most likely formed. [1]

    Circle one: land ocean Relative temperature of Earth’s surface:

    Allow 1 credit for circling ocean and correctly describing the relative temperature of Earth’s surface. Acceptable descriptions include, but are not limited to:

    • — warmer

    • — hot

    • — a tropical temperature

    • Note: Do not allow credit for a numerical answer because there are no temperatures indicated for

    • comparison.

    Base your answers to questions 13 on the map below, which represents the geographic source regions of two air masses, X and Y. The arrows represent the convergence of these air masses, which may result in tornadoes.

    reference-tables, key-to-weather-map-symbols, meteorology, presentation-of-weather-data, standard-6-interconnectedness, models fig: esci62012-exam_w_g63.png

    13

    Use the standard two-letter air-mass symbols to identify air-masses X and Y. [1]

    Air-mass X:

    Air-mass Y:

    Allow 1 credit for a correct response for both air-mass symbols. Allow credit even if all uppercase letters are used.

    • — Air-mass X: cP or cA

    • — Air-mass Y: mT

    • Note: Do not allow credit if the letters are reversed, such as Pc.

    Base your answers to questions 14 on the weather map below and on your knowledge of Earth science. The map shows the location of a wintertime low-pressure system over Lake Ontario with two fronts extending into New York State. Isobar values are recorded in millibars. Partial weather station data are shown for several locations.

    meteorology, presentation-of-weather-data, standard-1-math-and-science-inquery, use-isolines-to-determine-a-source-of-pollution, standard-6-interconnectedness, models fig: esci62018-examw_g59.png

    14

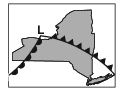
    State the compass direction toward which the center of this low-pressure system moved over the next two days if the low followed a normal storm track. [1]

    Allow 1 credit. Acceptable responses include, but are not limited to:

    • — East/E

    • — East northeast/ENE

    • — Northeast/NE

    • — North northeast/NNE

    Base your answers to questions 15 on the table below, on the map in image provided, and on your knowledge of Earth science. The table lists the latitude, longitude, and barometric pressure, in millibars (mb), of the center of a low-pressure system (L) as it moved across North America from March 14 to March 17. The map in image provided shows the center of this low-pressure system (L) and associated fronts on March 14. The location of the low-pressure system 24 hours later on March 15 is also indicated.

    meteorology, presentation-of-weather-data, standard-1-math-and-science-inquery, eccentricity-rate-gradient-standard-error, standard-6-interconnectedness, models fig: esci12015-examw_g57.png

    15

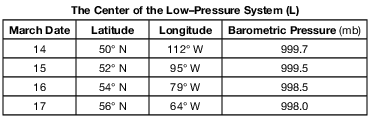
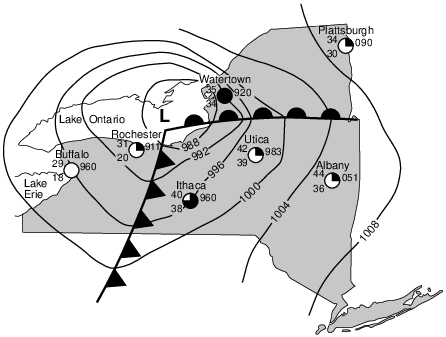
    On the station model in the image provided, using the proper format, record the barometric pressure of the low-pressure center (L) on March 16. [1]

    reference-tables, key-to-weather-map-symbols, meteorology, presentation-of-weather-data, meteorology, pressure-centers, standard-1-math-and-science-inquery, changing-length-of-a-shadow-based-on-the-motion-of-the-sun, standard-6-interconnectedness, models fig: esci12015-ansbk_abkq10.png

    Allow 1 credit for 985 placed in its proper location.

    • Example of a 1-credit response:

    reference-tables, key-to-weather-map-symbols, meteorology, presentation-of-weather-data, meteorology, pressure-centers, standard-1-math-and-science-inquery, changing-length-of-a-shadow-based-on-the-motion-of-the-sun, standard-6-interconnectedness, models fig: esci12015-rg_g9.png

    • Note: If other weather variables are included on the station model, only the barometric pressure

    • is to be scored.